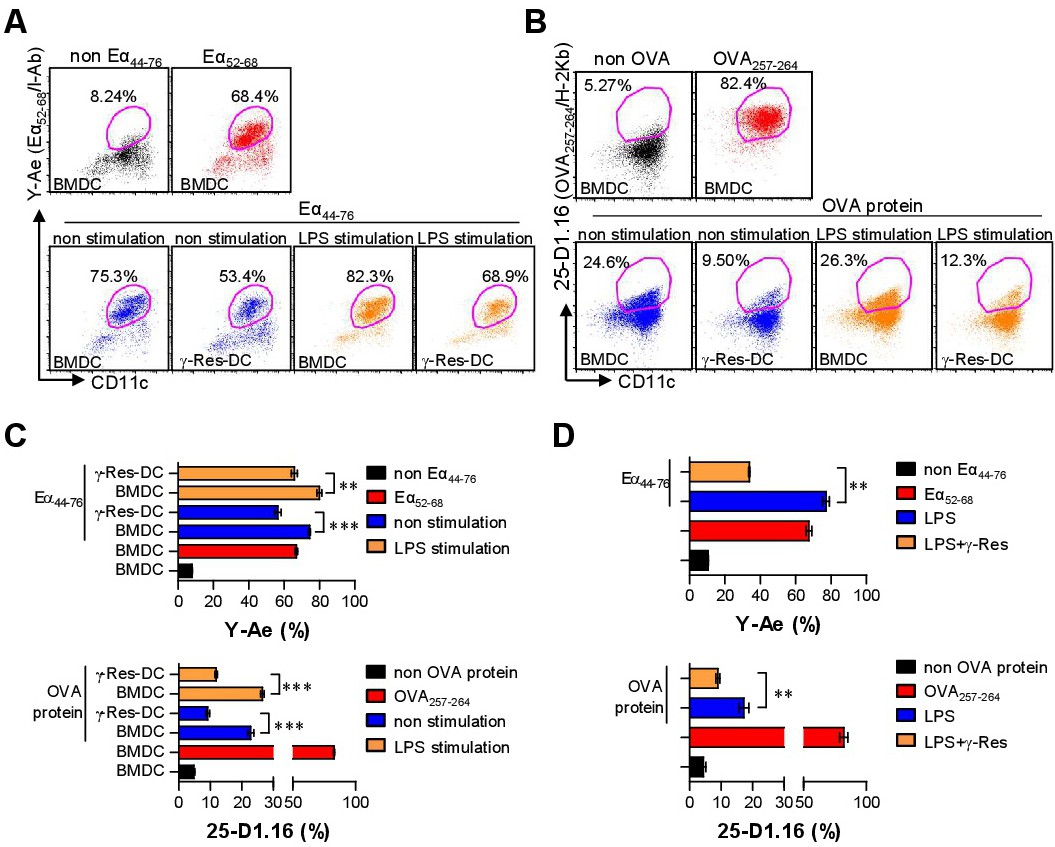
Fig. 7. Antigen-presenting ability in γ-Res-treated BMDCs and γ-Res-DCs in the presence of LPS. A-C) The BMDCs and γ-Res-DCs were treated with OVA (500 μg/mL) or Eα peptide (aa 44-76; 50 μg/mL) in the absence or presence of LPS (100 ng/mL). After incubation for 24 h, the cells were stained with anti-CD11c, anti-25-D1.16, or anti-Y-Ae Abs for 20 min. at room temperature. Dot plots for the expression of the Eα52-68/I-Ab complexes (C; top panel) and OVA257-264/H-2Kb (C; bottom panel) on the gated CD11c+ population are indicated. D) BMDCs (black bar), LPS-treated BMDC (blue bar) and LPS + γ-Res-treated BMDCs (orange bar) were treated with OVA (500 μg/mL) or Eα peptide (aa 44-76; 50 μg/mL) for 24 h. Dot plots for the expression of the Eα52-68/I-Ab complexes (top panel) and OVA257-264/H-2Kb (bottom panel) on the gated CD11c+ population are indicated. OVA257-264 or Eα52-68 peptide (1 μg/mL of each peptide); positive control. All results are representative of three independent experiments. All bar graphs show the means ± SD of three samples per group. **p<0.01, or ***p<0.001.